Tableau has built-in functionality to compute totals for almost any visualization. Simply drag Totals onto your viz, and Tableau will add a totals portion to the end of your viz. At first glance, you might think these totals were all computed similarly to table calculations – Tableau looks over the results of the query and computes based off of that. It’s a simple two-pass aggregation and Tableau can do it all in memory. If you tinker around a little more, however, you’ll find that that’s not the case. Take the below example.

We’re looking at AVG([Sales]) in three separate categories, and it returns 349.7, 119.3, and 452.7. The reference line (an average line) returns 307.3.
Now let’s ask (seemingly) the same question a different way by removing the reference line and adding totals.
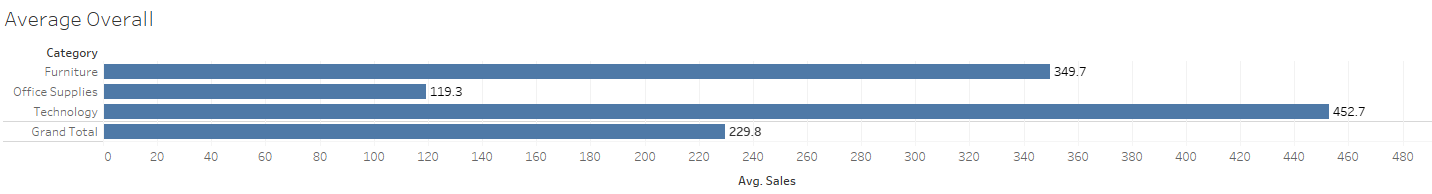
The total returns a different value… 229.8.What’s happening here?
Well, if we sum up the three values (349.7 + 119.3 + 462.7 = 921.7) and divide by 3, we get 307.3. The reference line is returning an average of averages (and somewhere, a statistician rolls over in his grave). The total bar, however, returns 229.8. Removing Category from the Rows shelf shows us that Tableau is returning the overall row-level average of sales.

What this proves to us is that Tableau is actually going back to the database and sending a separate query for the totals. What this means for us is that we can cheat totals. If we know that Tableau sends a query back for totals, we could create a calculation which returns different results for the totals bar.
The first thing we need to do is find a way to flag the totals bar in the query. Because my above visualization shows one bar per category, we know that COUNTD([Category]) will return 1. The totals bar, however, will return 3. Putting the logic into a calculation allows us to return…well…anything as our total.
Sales looking bad? Try the below!
IF COUNTD([Category]) = 1 THEN SUM([Sales]) ELSE MIN(10000000000) END
On a more practical side, however, it allows us to customize the behavior to what we need. Maybe you want each individual bar to display the average sales, but the grand total bar to display the total sales.
IF COUNTD([Category]) = 1 THEN AVG([Sales]) ELSE SUM([Sales]) END
Any (aggregate) business logic you want can now easily be built in there. As with any Tableau hack, of course, it leads to a couple more hacks as well, including custom waterfall charts and custom end-of-day totals.

One thought on “Custom Totals in Tableau”