Tableau 19.3 released this week, and with it came a whole host of features, including Server Management, Explain Data, and Data Catalog. Data Catalog (a part of the Data Management Add-on) allows you to see what data is being used on your Tableau instance, how people are using it, what tables they’re using in conjunction with what, and all of the associated lineage. On top of that, it allows you to write alerts, notify data users of outages/delays, and predict the impact of deprecating individual data assets. All of these features have created a renewed interest in the Data Management add-on, which also includes Prep Conductor.
One of the new features released within Prep in 2019.3 is the ability to use Python/R within your Prep flows. Now my experience with Python is effectively 0, but there is a really easy and cool use case worth documenting. Tableau has long had the ability to connect to API-based data through Web Data Connectors or the Extract/Hyper API, but both of these remove you from the Tableau interface. Hosting Web Data Connectors can be a hassle and require extra admin work, and the Hyper API exists entirely outside of Tableau, giving you little visibility to when (or if) tasks finish. The Python Prep node requires only that you create a function which take a dataframe as an argument and returns a dataframe, and this means you can now create entirely (or partly) web-based data connections entirely in-flow. The steps are below.
- Create a function which takes a dataframe as an argument.
- In that function, ping the necessary API.
- Convert the return from that API into a dataframe.
- Define the schema of that new dataframe.
- Save your Python work as a .py file.
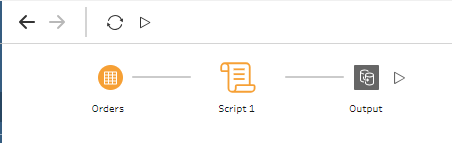
- Create a Prep flow with an input, a Script node, and an output.
- Publish it!
- Create a Python function. In a text editor of your choice, you’ll simply define a function. It must take a dataframe as an argument, as this will be the data passed from your Prep flow into the function.
def APIcall(df):2. Ping the necessary API. In this case, I’m using a stock-ticker API from alphavantage. You should get your own API key, but mine is published here. This API call returns a dictionary of CRM (our new overlord) stock data history. For this, I’m using the requests library.
def APIcall(df):
    r = requests.get("https://www.alphavantage.co/query?function=TIME_SERIES_DAILY&symbol=CRM&apikey=UT5SGBK00NBXYLK1&outputsize=full")
3. Convert the return from that API call into a dataframe. To do this, I’m using a couple of pieces. I use the json library to convert the string response from the API into a dict, then use pandas to convert the dict to a dataframe.
def APIcall(df):
    r = requests.get("https://www.alphavantage.co/query?function=TIME_SERIES_DAILY&symbol=CRM&apikey=UT5SGBK00NBXYLK1&outputsize=full")
   dfWorking = pd.DataFrame();
    data = json.loads(r.text)
    data = data["Time Series (Daily)"]
    dfWorking = pd.DataFrame.from_dict(data, orient='index')
    return dfWorking
This returns all of my data, but my dates are being used as an index, not a column.
def APIcall(df):
    r = requests.get("https://www.alphavantage.co/query?function=TIME_SERIES_DAILY&symbol=CRM&apikey=UT5SGBK00NBXYLK1&outputsize=full")
    dfWorking = pd.DataFrame();
    data = json.loads(r.text)
    data = data["Time Series (Daily)"]
    dfWorking = pd.DataFrame.from_dict(data, orient='index')
    dfWorking['date'] = dfWorking.index
    return dfWorking
4. Define (and match) the schemas. The Tableau help article here shows how to define the schema that we’re returning. On top of that, though, we need to make sure that our dataframe has the appropriate types. Even though the stock prices look like decimals, the API returned them as strings. First, I recast those values as floats, then I define the schema of the dataframe I’ll send back to Tableau. Make sure you also import all of the necessary libraries.
import requests;
import pandas as pd;
import json;
def APIcall(df):
    r = requests.get("https://www.alphavantage.co/query?function=TIME_SERIES_DAILY&symbol=CRM&apikey=UT5SGBK00NBXYLK1&outputsize=full")
    dfWorking = pd.DataFrame();
    data = json.loads(r.text)
    data = data["Time Series (Daily)"]
    dfWorking = pd.DataFrame.from_dict(data, orient='index')
    dfWorking['date'] = dfWorking.index
    dfWorking = dfWorking.astype({'5. volume': 'int32'})
    recast = ['1. open', '2. high', '3. low', '4. close'];
    for f in recast:
        dfWorking = dfWorking.astype({f: 'double'})
    return dfWorking
def get_output_schema():
    return pd.DataFrame({
        'date' : prep_date(),
        '1. open' : prep_decimal(),
        '2. high' : prep_decimal(),
        '3. low' : prep_decimal(),
        '4. close' : prep_decimal(),
        '5. volume' : prep_decimal(),
    });
5. Creating a Prep flow. This part is easy. Simply open Prep and connect to data. Even though the data we return will be entirely API-based, Tableau requires that you connect to a set of data (and it has to have at least one row). In my case, I used Superstore. Turns out you really can demo anything using only Superstore. You’ll need a TabPy server set up, but the rest is easy. Simply connect to any dataset, run your newly-created Python script, and create an output on Server. Now schedule that to refresh and you’ll get API-based data with all of the monitoring Tableau has to offer!
So how does this really work? Tableau takes in a dataframe from your datasource, throws out that data, and replaces it with your new dataframe. What else can we do with this? All sorts of things. Now you’ve got your API-based data in a Prep flow. Want to union it to something? Run cross-db joins? Pivot it? Join it to a published datasource so you can correlate stock prices with the times your customers purchase? The world is your oyster. Of course, you can also make more complex scripts. For example, you could simply incorporate a for-loop into this script an return the data for any number of tickers that you want. To find the history of Tableau, for example, I need both the CRM and DATA tickers. I’ve created an array below which allows for an input of tickers and an output of a hyper file with all of the stock data for both companies.
import requests;
import pandas as pd;
import json;
def APIcall(df):
	tickers = ["NKE", "CRM"];
	dfWorking = pd.DataFrame();
	recast = ['1. open', '2. high', '3. low', '4. close'];
	for i in tickers:
		r = requests.get("https://www.alphavantage.co/query?function=TIME_SERIES_DAILY&symbol=" + i + "&apikey=UT5SGBK00NBXYLK1&outputsize=full")
		data = r.text
		data = json.loads(data)
		data = data["Time Series (Daily)"]
		newFrame = pd.DataFrame.from_dict(data,orient='index')
		newFrame['date'] = newFrame.index
		newFrame['ticker'] = i
		dfWorking = dfWorking.append(newFrame)
	for f in recast:
		dfWorking = dfWorking.astype({f: 'double'})
	dfWorking = dfWorking.astype({'5. volume': 'int32'})
	return dfWorking


def get_output_schema():
    return pd.DataFrame({
        'date' : prep_date(),
        '1. open' : prep_decimal(),
        '2. high' : prep_decimal(),
        '3. low' : prep_decimal(),
        '4. close' : prep_decimal(),
        '5. volume' : prep_decimal(),
        'ticker' : prep_string()
    });
Make a viz out of that dataset and see exactly how valuable Tableau was to Salesforce! Or set up your own script and automate other cool workflows. Want to send out your dataset as a CSV? Simply incorporate that into the Python script. Even though it has to take in and return a dataframe, that doesn’t mean all it can do is ETL. Have fun with it!
