Skip to content

Gunning for Tableau

Hacks, Workarounds, and Anything Else I've Learned About Tableau

  • Home
  • Developer
  • Server
  • Desktop
  • About
  • Contact

Tag: metadata

Perf-OR-mance IN 20.3

Tableau 2020.3 has a ton of cool features coming with it, but one that hasn’t received the marketing budget it deserves is the IN operator. Tableau has always had the ability to do logic in calculated fields, but hasn’t ever had a graceful way to allow comparisons against arrays or lists. This has led customers to write all sorts of…interesting calculations.

Here we see that Tableau doesn’t make a distinction between ‘valid’ and ‘good’.

As much as I’d love to blame customers for this, Tableau hasn’t really had a way to handle this. Sure, you could join on some lookup tables or write out the long logic string, but it should be easier. With 2020.3, Tableau calcs will now support the IN operator, making this logic easy to implement. Not only will it be easier to write, however, it will also be more performant.

Cleaner, shorter, more readable, and more performant.

When a database is passed a series of OR operators, it will have to evaluate each condition individually. This is because there’s often multiple comparisons at play. For example, take a look at the below.

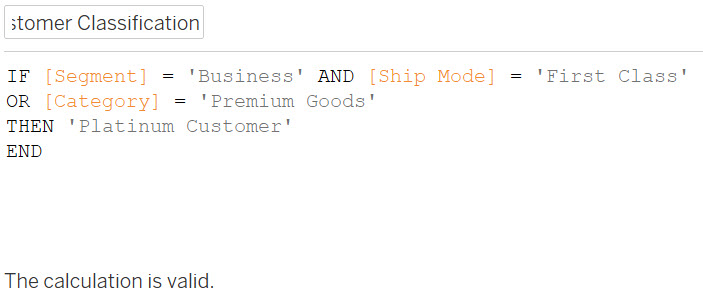
In this case, different dimensions are being used for different portions of the logic statement. Because of this, the database can’t assume that the calculation can be simplified. With an IN operator, we know we’re checking a single dimension, which allows far more efficient algorithms. MySQL, for example, sorts your list and performs a binary search. As a result of this, a calculated field with a couple of completely distinct OR operations will likely show improvements, but a logic statement with many ORs in a row will yield huge returns. This means an IN operator can be orders of magnitude faster than a series of individual ORs!

Apply it to Your Server

So now we know IN is faster as well as cleaner. If you’re about to install your first Tableau instance, that’s all you need to know! But for those of you with years of Tableau workbooks behind you, how can you go back and clean them all up? Luckily, the shiny new Metadata API (MDAPI) makes this easy to do. Below is a script which uses both the MDAPI and the REST API to authenticate into your server, find the calculations which would benefit most from some re-writing, and spits out a CSV (which you should put directly back into Tableau).

To start, we need to find the formula for every calculated field on your site. Once we have these, we can figure out which ones can be optimized.

query calcs {
  calculatedFields {
    name
    formula
    datasource {
        name
      ...on PublishedDatasource {
        luid
        name
        vizportalUrlId
      }
      ...on EmbeddedDatasource {
        workbook {
          luid
          vizportalUrlId
          name
        }
      }
    }
  }
}

This MDAPI query returns all the info we’ll need. Information like “formula” was previously not accessible at all in Tableau. Other info, like vizportalUrlID, was only accessible through the Postgres Repository. Other more structural pieces would have been incredibly difficult to piece together using just the REST API, requiring a chain of calls. Luckily the MDAPI can give us all this info in a centralized place with a single query.

Within each calculated field, the easiest way to find optimizations was consecutive uses of the word OR. This indicates multiple comparisons that, when evaluated, all compute the same piece of information. This won’t catch every place that you could put an IN, and not every string of ORs can be replaced with an IN, but its a good starting point. To do this, we parse each calculated field to find the beginning of a logic statement (and IF or CASE statement) and count the ORs before the close of the logic statement (a THEN). A calculated field with 4 individual OR statements represents some possible optimization, but a series of 50 ORs (like the state mapping above) indicates a huge opportunity. Therefore we count both total ORs in a calculated field and highest number of consecutive ORs.

#find every instance of IF or WHEN, indicating the start of a logic string
        or_instances = [m.start() for m in re.finditer('(IF|WHEN)', formula)]
        or_count = []
        for a in or_instances:
            #find the THEN that ends the logic string
            next_then = (formula.find('THEN',a))
            #count the ORs in between
            or_count.append(formula.count(' OR ',a, next_then))
            most_ORs = max(or_count)
            #compute longest string of ORs within the calc, as well as total ORs
            calcs_df.at[index, 'most_ORs'] = most_ORs
            calcs_df.at[index, 'total_ORs'] = sum(or_count)

The rest is just string cleanup, URL creation, and getting rid of any calcs that don’t matter. It isn’t perfect (and there are some bugs in the MDAPI that surface creative results), but it gives great visibility to any site admin who wants to reach out to their end users with easy action items for faster workbooks. After all, nobody has ever complained that Tableau was too fast. Grab the script from here, build a simple workbook, put in some URL actions, and put your publishers to work speeding up your server.

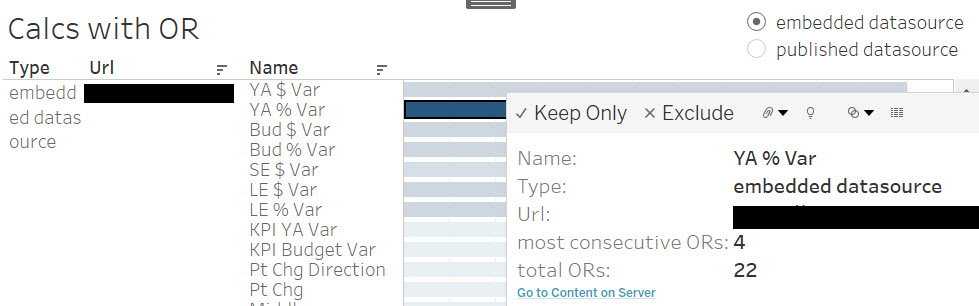
For my own demo site, I found calculations which had up to 22 instances of the word OR, including logic statements with 4 ORs in a row. This was against a simple test site, nothing near what you’ll likely see in production. See what performance gains you can get on your own site!

fgunning Developer, Server 2 Comments August 4, 2020August 4, 2020 4 Minutes

Data-Driven Data Refresh

Note: We say “the customer is always right”, and this ended up being a prime example of this. My initial recommendation to run a monthly schedule can actually be better implemented, so I’ve updated the post thanks to customer feedback.

Tableau’s scheduling capabilities are limited to time-based triggers. This gives decent flexibility, but doesn’t always fit the limits of real-life ETL processes.

“We have an ETL process slated to finish at 5am. Our users have set all of their extract refreshes to be 5:15am. This is great, but if our ETL lags behind at all, it misses their refresh. They’ve realized this, so they built in a second refresh at 5:30am. And just to be safe (and because they don’t pay for the hardware), they added a third refresh at 6am. Now each of their extracts is refreshing 3x daily. Assuming this happens for every datasource, we’re looking at roughly triple our Backgrounder utilization.”

Tons of customers

Instead of having time-based scheduling, why not use the brand-new Metadata API + REST API to have ETL-based triggers? Trick your users into thinking they’re running their schedule at 5:15am like normal, but kick the extract off only when their table finishes. If your ETL finishes early, you can actually start their refresh ahead of time! If ETL finishes late, you won’t waste an extract cycle refreshing against yesterday’s data. All we need is a hook from your ETL process which outputs the table name and a simple Python file.

  1. Create a schedule with the cadence that you’d like. In this case, I used “Daily”. Instead of running it daily, however, disable the schedule.
  2. Find a hook from your ETL process. Whenever a fact table finishes its ETL process, this hook will pass the table name to a Python script.
  3. Use the MD API to find any published datasources containing that table.
  4. Use the REST API to find if those datasources are set to refresh on a given day (Daily, Weekdays, Monthly, etc)
  5. Refresh any extracts that meet both of the above criteria.

Let’s take a look at each of those steps in a bit more detail.

  • Step 1 is easy in the Tableau UI. Create a schedule like you would for any other. Go to your Schedules pane, select the schedule, and toggle it to “Disabled”. This means tasks associated with the schedule won’t run…but people will be able to schedule tasks for this schedule.
This is lying to your users. But it’s for their own good! And they’ve abused your hardware for too long!
  • Any ETL process should be able to, upon completing, spit out the table name. We’ll need this to let us know when to refresh each Tableau datasource.
  • Using Tableau’s new metadata API, find all datasources which have your specific table name.
query relatedDatasources {
   databaseTables (filter: {name: "tablename"}){
      downstreamDatasources {
         luid
    }
  }
}

The above query searches your entire site for tables called “tablename”. It then looks for datasources downstream of that and returns the LUID for each one. The LUID is a unique identifier for the datasource in question. We need to run this in Python, which means either learning the odd GraphQL query syntax or copy-pasting my work.

#define our metadata api query to return datasources with our chosen table
mdapi_query = '''query relatedDatasources {
databaseTables (filter: {name: "'''+ table_name + '''"}){
    downstreamDatasources {
      luid
    }
}
}'''

#get datasources with table
metadata_query = requests.post(ts_url + '/api/metadata/graphql', headers = auth_headers, verify=True, json = {"query": mdapi_query})
mdapi_result = json.loads(metadata_query.text)

#find the LUID for each of those datasources
for i in mdapi_result['data']['databaseTables'][0]['downstreamDatasources']:
    needs_refresh.append(i['luid'])
  • Use the REST API to check if those LUIDs are set to refresh on the “Daily” schedule. This requires a couple of hops.
#return all schedules
schedule_list = requests.get(ts_url + '/api/3.5/schedules/', headers = auth_headers, verify=True)
schedule_list = json.loads(schedule_list.text)['schedules']['schedule']

#identify your chosen schedule
for i in schedule_list:
    if i['name'] == schedule_name:
            schedule_id = i['id']
            print(i['name'])

#identify all associated tasks from that schedule
task_list = requests.get(ts_url + '/api/3.5/sites/' + site_id + '/schedules/' + schedule_id + '/extracts', headers = auth_headers, verify=True)
task_list = json.loads(task_list.text)['extracts']['extract']

#return the IDs of those tasks
for i in task_list:
    on_schedule.append(i['id'])

Find the intersection of those two lists. We want to refresh only tasks that 1. Are set to the Daily schedule and 2. Contain the table in question. This is simply finding the intersection of our two lists.

#find the intersections of datasources with the table and datasources on our schedule
run_now = list(set(needs_refresh).intersection(on_schedule))

Now that we’ve got our list of tasks, there’s nothing left to do but run them. For this to work, your Server Admin must have enabled Run Now access for extracts on your TS instance.

#run tasks
for i in run_now:
    requests.post(ts_url + '/api/3.5/sites/'+ site_id + '/tasks/extractRefreshes/' + i + '/runNow')

That’s it!

So to put it all together, here’s what you’ll need to do. Put all of that together into one Python script (available here). Fill out the appropriate variables in that script (server URL, username, etc).

Set it up in your environment in such a way that any time an ETL process finishes on one of your fact tables, it kicks off this Python script and passes in the table name. If you have non-daily extract refresh schedules, then you’ll want to build in some date-checking as well (if you’re setting up a weekly refresh, maybe pass in the table name then check if today = Monday).

There’s some more to be done here, depending on your use case. This only refreshes published datasources, not embedded ones (pushing people towards embedded). The MDAPI query can be easily modified to fix that. Some of your users may have datasources containing multiple fact tables, so in this case it would refresh your datasource a couple of times. It may be worth building in specific logic to handle this.

Overall, this is built as a simple example of how a new feature (the Metadata API) can be a hugely powerful feature for any Server Admin to buy back a ton of CPU cycles that have been historically wasted by your business users. Enjoy!

fgunning Developer, Server 2 Comments April 27, 2020August 14, 2020 4 Minutes

Top Posts

  • All for Some, and Some for All
  • Web Data...Conductors?
  • [Multi-Value, Multi-Column] Row Level Security: Solving an Array of Use Cases
Blog at WordPress.com.
  • Follow Following
    • Gunning for Tableau
    • Already have a WordPress.com account? Log in now.
    • Gunning for Tableau
    • Customize
    • Follow Following
    • Sign up
    • Log in
    • Report this content
    • View site in Reader
    • Manage subscriptions
    • Collapse this bar
 

Loading Comments...