Tableau as Traditional BI

Tableau was one of the early self-service BI vendors, and has really made it’s impact by allowing any end user to not only access data, but to interact with it, ask their own questions, and build their own vizzes. The idea is to actually empower users to get what they want out of data, rather than what you prescribe.

That said, having sold Tableau for 4.5 years, I’ve come to realize that no matter how great self-service BI is, there are certain pieces of “Traditional BI” that people can’t let go of, no matter how value-less they seem. After hearing the same request enough times, sometimes you just have to cave to tradition and allow the Cognos users their one feature request.

“The less there is to justify a tradition…the harder it is to get rid of it” — Mark Twain

Luckily, the 19.3 release of Tableau came with two features which make this incredibly easy. The ability to use Python in your Prep flows makes it really easy for anyone who can write Python to distribute CSVs. A 20-line Python script could distribute the relevant data to the users you want, but not everyone can write Python. The reusable steps option in Prep Builder 19.3 makes it easy to socialize this content, providing an easy skeleton for any user to use your Python flow.

The last piece of the puzzle is choosing the end users who should receive the report. By building a consistent table which can be incorporated into your flow, you can centralize this piece as well. I’ll walk through the steps below.

One column has a list of Groups you’d like to send the email to, one column has the name of the Site those Groups exist on, and one column has the File Name that the CSV should be distributed with.
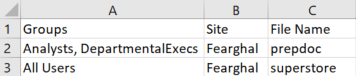
  • Build a Distribution Table. This can be in a database or a simple CSV document, and should have the below structure.
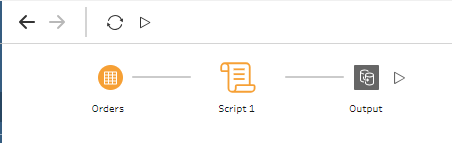
  • Create a Tableau Prep flow. This can be as simple as a single file that you want to send as a CSV or it could be a 100-step Prep flow coming from 20 datasources.
  • Filter your Distribution Table so it returns only one row: the desired groups for distribution.
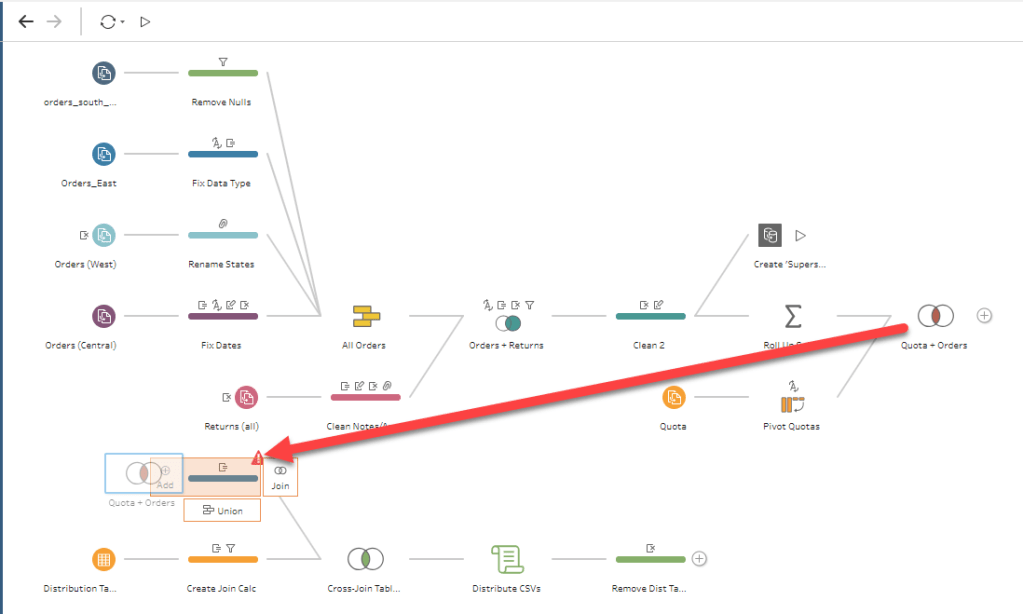
  • Join your Flow Result to your Distribution Table. There’s no matching columns here, so you’ll need to join on 1=1. This will perform a cross join, adding the Group Names to every row of your Prep Flow.
  • Add a Script step (more details below).
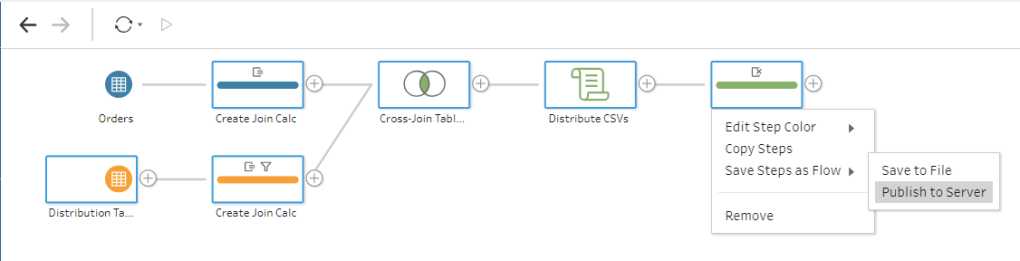
  • Add an output, publish your Flow, and schedule it to refresh on the schedule of your choosing!

Once you’ve followed the above steps, Tableau will, at the appropriate interval that you’ve chosen, run your entire ETL flow, send a CSV to all of the appropriate users, and publish the .hyper file to Tableau Server. You can even make this resuable by publishing up all of the “scheduling” steps to your Tableau Server so other people can reuse it.

Publish the entire flow except the data input step. This makes it a reusable distribution tool for other to download and plug into their own flows!
Right-click and insert the published steps into any flow you’re working on.
Drag the output of your existing flow as the input to your inserted flow. Change the filters on your Distribution Table to the desired schedule and simply publish your new flow. It’ll send to the chosen groups on the schedule of your choosing.

So what’s the magic of the Python script? It does a couple things in this case, and all of the code is available here. It does a couple of things.

  1. Logs in to Tableau Server.
  2. Gets the list of all users on the Site.
  3. Finds which users are in the specified Groups.
  4. Compiles a list of those addresses.
  5. Sends an email to all of those people!

I’ve broken it out into two functions.

  • emailer()
  • GroupMailer()

The emailer() function is pretty simple. It takes two arguments: a list of emails and a dataframe. Tableau Prep’s Python integration requires that you create a function which takes in a dataframe and returns a dataframe. In this case, we’re just taking in the data that you’d like to distribute. We do no modifications at all to it, just send it via email and return it to Tableau Prep.

The GroupMailer function is the more complex one. It leverages a couple calls from Tableau’s REST API to find all of the necessary email addresses and compile them into a list, which is then used in the emailer() function. You could, of course, create your own list of email addresses and pass that in instead.

To facilitate that, I built a separate function called PersonMailer(). It functions almost exactly like the GroupMailer() function, but allows you to pass in comma-separated email addresses instead of relying on Tableau to generate them. The downside of this is that it’s harder to scale (reports often go to thousands of users), but the upside is that these users don’t need to be licensed on Tableau Server! We’re simply using Python to send the emails out, so if you need to send it to unlicensed users, distribution lists, or dummy email addresses, this function should work perfectly for you.

Web Data…Conductors?

Tableau 19.3 released this week, and with it came a whole host of features, including Server Management, Explain Data, and Data Catalog. Data Catalog (a part of the Data Management Add-on) allows you to see what data is being used on your Tableau instance, how people are using it, what tables they’re using in conjunction with what, and all of the associated lineage. On top of that, it allows you to write alerts, notify data users of outages/delays, and predict the impact of deprecating individual data assets. All of these features have created a renewed interest in the Data Management add-on, which also includes Prep Conductor.

One of the new features released within Prep in 2019.3 is the ability to use Python/R within your Prep flows. Now my experience with Python is effectively 0, but there is a really easy and cool use case worth documenting. Tableau has long had the ability to connect to API-based data through Web Data Connectors or the Extract/Hyper API, but both of these remove you from the Tableau interface. Hosting Web Data Connectors can be a hassle and require extra admin work, and the Hyper API exists entirely outside of Tableau, giving you little visibility to when (or if) tasks finish. The Python Prep node requires only that you create a function which take a dataframe as an argument and returns a dataframe, and this means you can now create entirely (or partly) web-based data connections entirely in-flow. The steps are below.

  1. Create a function which takes a dataframe as an argument.
  2. In that function, ping the necessary API.
  3. Convert the return from that API into a dataframe.
  4. Define the schema of that new dataframe.
  5. Save your Python work as a .py file.
  6. Create a Prep flow with an input, a Script node, and an output.
  7. Publish it!
  1. Create a Python function. In a text editor of your choice, you’ll simply define a function. It must take a dataframe as an argument, as this will be the data passed from your Prep flow into the function.
def APIcall(df):

2. Ping the necessary API. In this case, I’m using a stock-ticker API from alphavantage. You should get your own API key, but mine is published here. This API call returns a dictionary of CRM (our new overlord) stock data history. For this, I’m using the requests library.

def APIcall(df):
    r = requests.get("https://www.alphavantage.co/query?function=TIME_SERIES_DAILY&symbol=CRM&apikey=UT5SGBK00NBXYLK1&outputsize=full")

3. Convert the return from that API call into a dataframe. To do this, I’m using a couple of pieces. I use the json library to convert the string response from the API into a dict, then use pandas to convert the dict to a dataframe.

def APIcall(df):
    r = requests.get("https://www.alphavantage.co/query?function=TIME_SERIES_DAILY&symbol=CRM&apikey=UT5SGBK00NBXYLK1&outputsize=full")
   dfWorking = pd.DataFrame();
    data = json.loads(r.text)
    data = data["Time Series (Daily)"]
    dfWorking = pd.DataFrame.from_dict(data, orient='index')
    return dfWorking

This returns all of my data, but my dates are being used as an index, not a column.

def APIcall(df):
    r = requests.get("https://www.alphavantage.co/query?function=TIME_SERIES_DAILY&symbol=CRM&apikey=UT5SGBK00NBXYLK1&outputsize=full")
    dfWorking = pd.DataFrame();
    data = json.loads(r.text)
    data = data["Time Series (Daily)"]
    dfWorking = pd.DataFrame.from_dict(data, orient='index')
    dfWorking['date'] = dfWorking.index
    return dfWorking

4. Define (and match) the schemas. The Tableau help article here shows how to define the schema that we’re returning. On top of that, though, we need to make sure that our dataframe has the appropriate types. Even though the stock prices look like decimals, the API returned them as strings. First, I recast those values as floats, then I define the schema of the dataframe I’ll send back to Tableau. Make sure you also import all of the necessary libraries.

import requests;
import pandas as pd;
import json;
def APIcall(df):
    r = requests.get("https://www.alphavantage.co/query?function=TIME_SERIES_DAILY&symbol=CRM&apikey=UT5SGBK00NBXYLK1&outputsize=full")
    dfWorking = pd.DataFrame();
    data = json.loads(r.text)
    data = data["Time Series (Daily)"]
    dfWorking = pd.DataFrame.from_dict(data, orient='index')
    dfWorking['date'] = dfWorking.index
    dfWorking = dfWorking.astype({'5. volume': 'int32'})
    recast = ['1. open', '2. high', '3. low', '4. close'];
    for f in recast:
        dfWorking = dfWorking.astype({f: 'double'})
    return dfWorking
def get_output_schema():
    return pd.DataFrame({
        'date' : prep_date(),
        '1. open' : prep_decimal(),
        '2. high' : prep_decimal(),
        '3. low' : prep_decimal(),
        '4. close' : prep_decimal(),
        '5. volume' : prep_decimal(),
    });

5. Creating a Prep flow. This part is easy. Simply open Prep and connect to data. Even though the data we return will be entirely API-based, Tableau requires that you connect to a set of data (and it has to have at least one row). In my case, I used Superstore. Turns out you really can demo anything using only Superstore. You’ll need a TabPy server set up, but the rest is easy. Simply connect to any dataset, run your newly-created Python script, and create an output on Server. Now schedule that to refresh and you’ll get API-based data with all of the monitoring Tableau has to offer!

So how does this really work? Tableau takes in a dataframe from your datasource, throws out that data, and replaces it with your new dataframe. What else can we do with this? All sorts of things. Now you’ve got your API-based data in a Prep flow. Want to union it to something? Run cross-db joins? Pivot it? Join it to a published datasource so you can correlate stock prices with the times your customers purchase? The world is your oyster. Of course, you can also make more complex scripts. For example, you could simply incorporate a for-loop into this script an return the data for any number of tickers that you want. To find the history of Tableau, for example, I need both the CRM and DATA tickers. I’ve created an array below which allows for an input of tickers and an output of a hyper file with all of the stock data for both companies.

import requests;
import pandas as pd;
import json;
def APIcall(df):
	tickers = ["NKE", "CRM"];
	dfWorking = pd.DataFrame();
	recast = ['1. open', '2. high', '3. low', '4. close'];
	for i in tickers:
		r = requests.get("https://www.alphavantage.co/query?function=TIME_SERIES_DAILY&symbol=" + i + "&apikey=UT5SGBK00NBXYLK1&outputsize=full")
		data = r.text
		data = json.loads(data)
		data = data["Time Series (Daily)"]
		newFrame = pd.DataFrame.from_dict(data,orient='index')
		newFrame['date'] = newFrame.index
		newFrame['ticker'] = i
		dfWorking = dfWorking.append(newFrame)
	for f in recast:
		dfWorking = dfWorking.astype({f: 'double'})
	dfWorking = dfWorking.astype({'5. volume': 'int32'})
	return dfWorking


def get_output_schema():
    return pd.DataFrame({
        'date' : prep_date(),
        '1. open' : prep_decimal(),
        '2. high' : prep_decimal(),
        '3. low' : prep_decimal(),
        '4. close' : prep_decimal(),
        '5. volume' : prep_decimal(),
        'ticker' : prep_string()
    });

Make a viz out of that dataset and see exactly how valuable Tableau was to Salesforce! Or set up your own script and automate other cool workflows. Want to send out your dataset as a CSV? Simply incorporate that into the Python script. Even though it has to take in and return a dataframe, that doesn’t mean all it can do is ETL. Have fun with it!

Publishing TDS Datasources Using Tableau Prep

NOTE: Tableau went and fixed this in 19.3.1, so if you’re using that or a newer version, stop reading here and just accept that it all works!

Though Tableau originated as a visualization tool, it has added significant ETL processes over the last couple versions. With version 18.1 it added Tableau Prep and the ability to build ETL flows, and 19.1 added Prep Conductor, which comes with the ability to automate workflows to run on a schedule. One current limitation, however, is that Tableau Prep outputs a .hyper file, not a .tdsx file. What’s the difference here?

In Tableau, a .hyper file is a raw data file. It contains the results of the data from the datasources as well as any calculations which can be materialized at the individual row level (calculations like string manipulations, differences between two columns, etc.). Calculations which can’t be materialized on individual rows, however, aren’t stored in a .hyper file, but instead are saved in a .tds file (Tableau Datasource). This file contains the logic for level of detail calculations, aggregate calculations (such as ratios), and the username-based calculations often used for row level security. A .tdsx file is the combination of the raw data (.hyper file) and the associated logic (.tds file). Tableau Prep, however, doesn’t allow for the customization of .tds files. If you want to add aggregate calculations, you can do so in Desktop, but when Conductor runs your flow, it will overwrite your entire Datasource, replacing your .tds file with a generic one and losing all of your calculations in the process. Below is a walk-through of how to avoid that behavior.

Before we go any further, it’s worth noting that this workflow will probably be streamlined at some point, but that for now, this is the easiest way of allowing creating a Datasource with data from Prep and .tds-based logic.

  1. Create a Prep flow which outputs a .hyper file to a network-mapped location.
    1. In the Output step of your Prep flow, do not select “Publish as a data source”, but instead choose “Save to File”. You need to ensure that your Prep inputs and outputs are using UNC file paths, so it will continue to work when published to Server.
  2. Publish and schedule the flow.
    1. Simply publish your flow to Tableau Server. You’ll need to ensure that your Run As User has access to the file input/output locations as well as safelisting those file locations for Prep Conductor.
    2. Though we’ll tie this flow to a schedule, we won’t actually be relying on the schedule’s timing to run the flow. Therefore, you’ll want to make it a schedule that you don’t use for anything else and only runs very infrequently. I set mine to run monthly on a schedule named “PrepScriptSchedule”. The reason we need to tie it to a schedule (even though we aren’t relying on timing) is that tabcmd allows us to run a scheduled task.
  3. Open the output of the flow in Tableau Desktop.
  4. Create your Datasource modifications in Desktop (create calculations, Datasource filters, hierarchies)
  5. Publish the Datasource.
  6. Using tabcmd, refresh the .hyper file and publish it without overwriting the Datasource.
    1. If you’re not already using tabcmd, you’ll need to install it.
    2. Log in to the Server using tabcmd login.
    3. Run the Prep flow using tabcmd runschedule.
      1. Because we’re running a schedule (not executing a task on Tableau Server), we’ll need to build in a wait time for our script. This step has started the Prep Flow, but we’ll need to pause until it finishes creating the file.
    4. Pause the script until the flow is complete using SLEEP. This command takes an argument which is the number of seconds to pause your script. You should make sure that the number you input here is higher than the time your Prep Flow takes to run.
    5. Using the tabcmd publish command, point to the .hyper file output from the Prep flow and overwrite the Datasource in question. Use the –replace option to avoid overwriting the .tds, instead just overwriting the source data contained in the .hyper file.
tabcmd login -s https://<server-name> -u <username> -p <password> -t <siteName>
tabcmd runschedule "PrepScriptSchedule"
sleep 1000
tabcmd publish "\\network\filepath\prepoutput.hyper" -n <targetDatasource> --replace

It’s an easy script to run, and can be run on the schedule of your choice using any task scheduler (most likely Windows Task Scheduler or as a cron job). Using the above script we can create Tableau Datasources with Prep ETL, Desktop metadata, and Server security, and refresh it all on a schedule. Go forth and enjoy your complex data structures with complex governance tied in!