
Totals in Tableau have the ability to aggregate your data a number of different ways, and it takes care of 90% of the use cases for totals. Often, however, people want to look at end-of-period totals. Imagine you run a store and count inventory at the end of every week. You may want to build a crosstab that shows inventory at the end of each week, but also add totals for the month, quarter, and year level. The yearly total obviously shouldn’t show the summation of every week for the year…that doesn’t help you figure out what you have on-hand. Don’t worry, its easy possible in Tableau!
The end-of-period total is useful for inventory managers, any type of finance (end of day balances), and anybody tracking non-additive time series metrics. Before we get to the solution, it’s important to understand how totals work. Once you’ve got that down, the rest is just figuring out logic and syntax.
The logic is simple. If we’re looking at a single cell (the granularity of your data), just return that data. If we’re looking at any total, only return the data from the most recent date. Normally, we’d cohort out the most recent date using something like the below.
RUNNING_MAX(ATTR([Date]))We’d then need to compare that date to a row-level date, though. There’s our problem. If you try the below calc, you’ll end up with an error for comparing row-level data to aggregate data.
IF RUNNING_MAX(ATTR([Date])) = [Date] THEN [Inventory] ELSE 0 ENDTable calcs will always return aggregates. What we need to do is find a way to return the running-max date as a row level result so we can use it in comparisons. To do this, we can use EXCLUDE or FIXED. Normally, I use FIXED equations when given the option, simply because they’re less viz-dependent. You can build one calc and use it on 15 different sheets, almost regardless of their dimensionality. In this case, however, we’re custom-building a calc for the sheet anyway. FIXED has funnier behavior with filters, so in this case I’ll use EXCLUDE.
The first thing we need to do is ensure that we return the appropriate value for individual cells.
IF COUNTD([Week-ID]) = 1 THEN SUM(Inventory)
END
Next we need to take into account monthly totals.
IF COUNTD([Week-ID]) = 1 THEN SUM(Inventory)
   ELSEIF COUNTD(DATEPART('month',[Date])) = 1 THEN
       SUM(IF [Week-ID] = {EXCLUDE [Week-ID] : MAX([Week-ID])} THEN [Inventory] END)


END
Looking at the above calc, we accomplish a couple of things in sequence. First, we need to identify the monthly total. We know all single cells were caught by line 1 of the calculation, so anything else will be a total. We specifically want to identify a monthly total, though. Simply checking if COUNTD of months = 1 will ensure we’re looking at the monthly total.
Next, we need to isolate the most recent week. We do this using our EXCLUDE function. Our viz is calculating the the level of year, quarter, month, and week. We need to find the highest week-id of the month. To calculate at that level, we simply need to exclude week-id from the calculation.
Now we’ve identified the highest week value, we need to find the inventory value associated with it. This is where our if-then logic comes in. Only one week will match the highest week-id, so IF <Exclude function returning max week id> = [Week-ID] THEN [Inventory] END returns the inventory associated with that week.

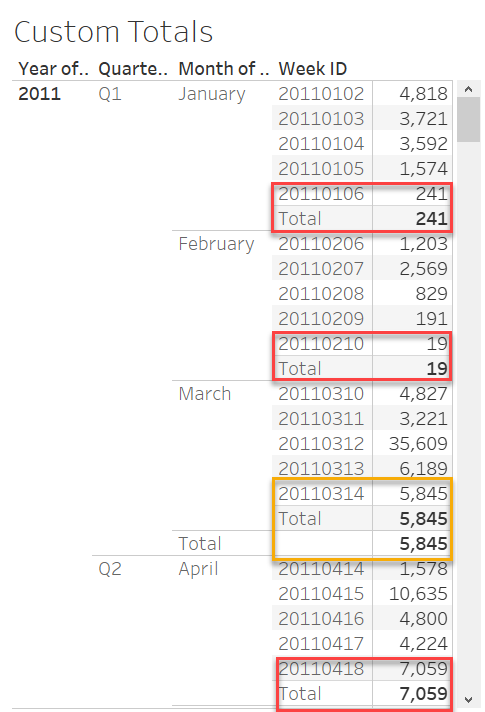
Looking at the above image, you see we’ve successfully fixed some of our totals! There’s still some to go, however. The quarterly total is currently displaying as the sum of our monthly totals…and this makes sense. Remember, our EXCLUDE statement returned data at the level of year-quarter-month, excluding week. When Tableau queries for this total, it is returned 3 numbers (one for each month) and then sums them together. To get our quarterly numbers to compute correctly, we need to add the below into our calculation.
ELSEIF COUNTD(DATEPART('quarter',[Date])) = 1 THEN
    SUM(  IF [Week-ID] = { EXCLUDE [Week-ID], DATEPART('month',[Date]) : MAX([Week-ID])} THEN [Inventory] END)
This takes care of our quarterly totals, but our yearly totals will still mis-compute. You’ll need to add one of these clauses for each level of totals that you want to display, and add them sequentially from most granular to most aggregate. In the end, your calc should look like the below.
IF COUNTD([Week-ID]) = 1 THEN SUM([Inventory])
ELSEIF COUNTD(MONTH([Date])) = 1 THEN
  SUM(  IF [Week-ID] = { EXCLUDE [Week-ID] : MAX([Week-ID])} THEN [Inventory] END)
ELSEIF COUNTD(DATEPART('quarter',[Date])) = 1 THEN
SUM(  IF [Week-ID] = { EXCLUDE [Week-ID], DATEPART('month',[Date]) : MAX([Week-ID])} THEN [Inventory] END)
ELSEIF COUNTD(YEAR([Date])) = 1 THEN
SUM(  IF [Week-ID] = { EXCLUDE [Week-ID], DATEPART('month',[Date]), DATEPART('quarter',[Date]) : MAX([Week-ID])} THEN [Inventory] END)
ELSE
SUM(  IF [Week-ID] = { EXCLUDE [Week-ID], DATEPART('month',[Date]), DATEPART('quarter',[Date]),DATEPART('year',[Date]) : MAX([Week-ID])} THEN [Inventory] END)
END
There you have it. This calc returns your most recent value as your total, instead of accepting Tableau’s defaults. Because we used EXCLUDE, it will respond to all of your filters, regardless of it they’re on context or not. I’ve found this solution to hold up fairly well in production, but keep in mind that if you’re running this against billions of rows of data, it may slow down. Most end-of-day datasets don’t grow to that size (there’s only been about 10,000 days since the world wide web became publicly available), so plug this in and let me know how it works!




